

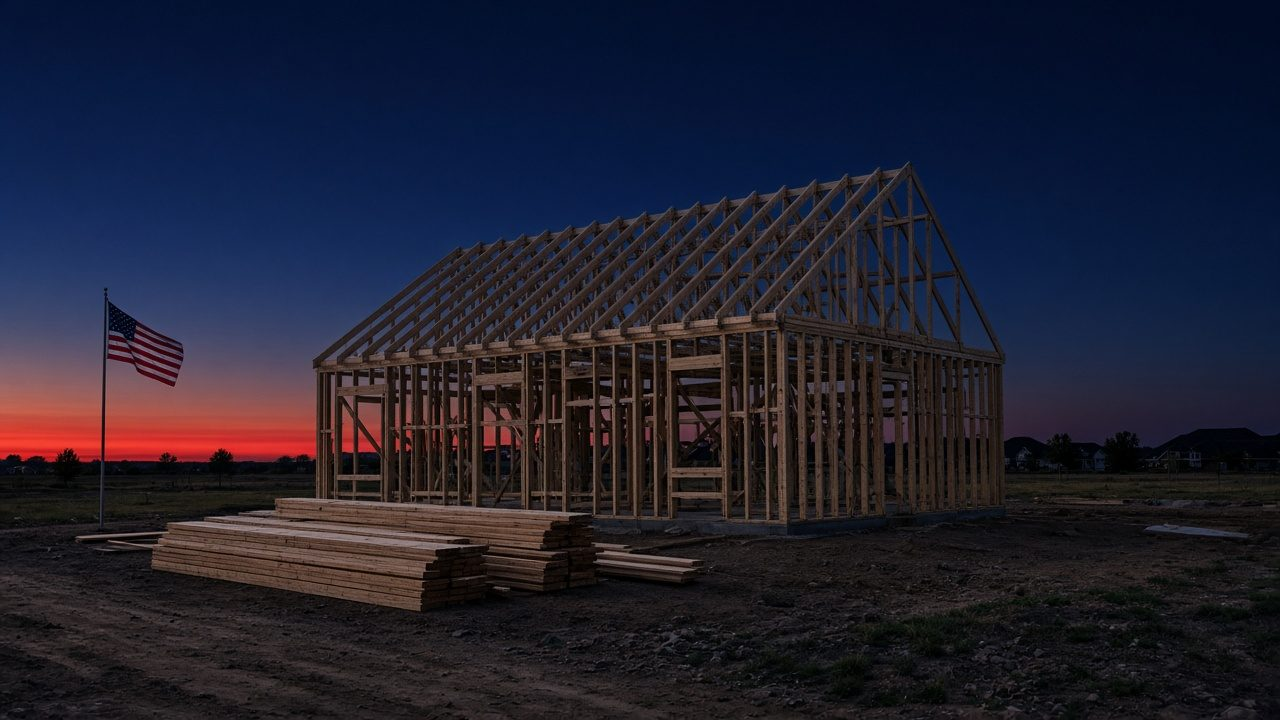
Why is housing so expensive? The short answer is that America spent a decade building far too few homes, and then made every new one cost more to build and finance. Prices did what prices do when supply can’t keep up.
The numbers back that up. Harvard’s Joint Center for Housing Studies says the median existing single-family home sold for nearly five times the median household income in 2025. Throughout the 1990s, that ratio averaged 3.2. So the same paycheck now buys a lot less house.
I covered the sales slump in my existing home sales column. This piece steps back from the monthly reports. I want to walk through the structural reasons, one at a time, with the numbers attached.
Why Is Housing So Expensive? Start With the Homes We Never Built
The biggest cause is the oldest one. After the 2008 crash, builders stopped building, and they stayed stopped for years.
Census Bureau construction data show housing starts fell to 554,000 in 2009. That was the lowest annual total in a series that goes back to 1959. Then the recovery crawled. Across the whole 2010s, starts averaged about 993,000 a year.

For comparison, every decade from the 1960s through the 2000s averaged between 1.37 million and 1.77 million starts a year. By my own rough math, the 2010s fell about 5.2 million starts short of that 50-year average pace. That math ignores demolitions and population growth, so it isn’t a precise shortage figure. Still, it shows the size of the hole.
Building did pick up after 2020. Starts averaged about 1.45 million a year from 2020 through 2025. However, a few good years can’t refill a lost decade, and the pace is slipping again. In September 2026, starts ran at a 1.22 million annual rate.
How Big Is the Housing Shortage?
Nobody agrees on one number, and that’s worth saying plainly. Freddie Mac estimates the country was 3.7 million homes short as of the third quarter of 2024. The National Association of Home Builders puts the structural deficit at 1.2 million units. Other estimates run higher.
The Congressional Research Service reviewed the most common figures in December 2025. It found most of them landing between roughly 4 million and 5 million homes. CRS also noted there’s “not universal agreement” that a shortage exists at all, because the methods differ.
I respect that caution. Even so, the low-end estimates still describe a market that’s short. Low inventory, rising rents and record cost burdens all point the same direction.
Regulation Now Makes Up a Quarter of a New Home’s Price
Here is the cause that gets too little attention. In June 2026, the National Association of Home Builders estimated that regulation at every level of government adds $131,734 to the price of an average new home. That’s 26.4% of the $499,500 average sales price.
The trend is worse than the level. NAHB’s figure was $93,870 in 2021, so it rose more than 40% in about five years. Over the same stretch, disposable income rose just 18.3%, according to the group.
Most of that increase came during construction, not land development. NAHB pins it largely on higher building permit fees and building code changes. Then add zoning. When a city allows only one house per lot on most of its land, it caps how many homes can exist there.
Builders have an interest in saying this, of course. The estimate also rests on surveys of NAHB’s own members. Fair enough. But fees, codes and zoning maps are public records, and they mostly come from city halls and statehouses, not Wall Street.
Lumber, Land and Labor Got More Expensive Too
Next comes the plain cost of materials. Harvard’s State of the Nation’s Housing 2026 reports that the combined price of inputs to residential construction has jumped 40% since January 2020. Gypsum rose 47% and steel mill products 84% through April 2026. The report says new tariffs pushed up some prices in 2025.
Land got pricier as well. Lot values climbed 52% between 2020 and 2024, according to an American Enterprise Institute measure the report cites. In addition, 62% of builders expected lot availability to be a significant challenge in 2026.
Labor is the third piece. The Harvard report notes that foreign-born workers make up a large share of construction crews. It warns that tighter immigration policy could raise costs further. That’s a real tradeoff, and any honest housing debate should account for it.

The Mortgage Rate Lock-In Effect
Prices aren’t only about how many homes exist. They’re also about how many come up for sale. Right now, millions of owners are staying put.
According to the Harvard report, half of all outstanding mortgages carried a rate below 4% as of late 2025. Meanwhile, the 30-year rate in Freddie Mac’s weekly survey was 7.11% on Nov. 12, 2026. Selling means giving up a cheap loan for an expensive one, so many owners simply don’t.
That freezes the ladder. Young families can’t find starter homes, because the owners who would move up are locked in. As a result, existing home sales stayed below 4.1 million a year from 2023 through 2025.
Rates themselves trace back to inflation and the Federal Reserve. If you want the mechanics, I explained how the Fed raises interest rates and why it doesn’t set your mortgage rate directly.
Taxes and Insurance: The Bills After Closing
Even a buyer who clears the down payment faces costs that keep climbing. The Harvard report cites ICE data showing property taxes rose 31% nationwide between 2019 and 2025. Average monthly insurance premiums jumped 72%, to $201.
Put it all together, and the monthly bill is steep. Harvard estimates principal and interest on the median-priced home ran $2,420 a month at the end of 2025, assuming 3.5% down. After adding insurance and property taxes, the total reached $3,120.
To afford that, a household needed about $120,800 a year. Five years earlier, the figure was $68,700. Just 32% of households now meet the bar. By comparison, Census data put 2025 median household income at $87,460.
What Each Side Says About the Fix
Both parties now say they want more housing. They disagree on who should pay and who should get out of the way.
The Case for More Subsidies
Many on the left, and many housing advocates, argue the market can’t produce cheap homes without help. The Harvard report says “significant public subsidies are essential” for the lowest-rent units. Supporters also back down-payment aid, like the $1,000-down FHA idea from my home sales column.
There’s something to the narrow version of this argument. Deeply affordable rentals rarely pencil out on their own. Still, subsidizing buyers in a market short on homes mostly helps sellers raise prices.
The Case for Building and Getting Out of the Way
The supply side argues the fastest relief is more homes, built cheaper. That means looser zoning, faster permits, smaller lots, lower fees and fewer code mandates. Interestingly, the Harvard report gives this camp credit too. It notes that Maine and Washington now allow small multifamily buildings on single-family lots. Iowa and Arkansas now allow accessory dwelling units by right statewide.
My Take: Housing Is Expensive Because Government Made Building Expensive
My take is simple, and it starts with the numbers. A home is a product. When you build too few of them for a decade, then pile on fees, codes and zoning limits, the price goes up. No subsidy can repeal that math.
Washington deserves blame for the financing side too. The 30-year rate hit 2.65% in January 2021, the lowest in Freddie Mac’s survey. Since 2020, home prices have risen 54% nationally, according to Harvard. Cheap money and heavy federal spending fueled that run, and the inflation that followed pushed rates back above 7%.
That’s why I’m skeptical of demand-side fixes. Down-payment grants and new loan programs feel generous. But they add buyers without adding homes, and that bids prices higher. Even the mortgage insurance order I liked only trims costs at the margin.
The real fix is mostly local, and that’s good news for conservatives. Your city council and your state legislature control zoning, permit timelines and impact fees. Those are the levers that cut the price of a home before anyone signs a loan.
Build First, Then Talk About Help
The answer to why housing is so expensive isn’t a mystery. We underbuilt for a decade, made building cost more, and then let inflation drive rates higher. Every one of those causes has a policy behind it.
So the test for any housing plan, from either party, is one question. Does it add homes, or does it add buyers? If it only adds buyers, it’ll raise the price of the shortage. If it adds homes, it attacks the reason prices rose in the first place.
Sources
- U.S. Census Bureau and HUD: New Residential Construction (annual and monthly housing starts, 1959 to September 2026)
- Freddie Mac Economic and Housing Research: Housing Supply: Still Undersupplied by Millions of Units (3.7 million-unit shortage, Q3 2024)
- Congressional Research Service: Estimates of a “Housing Shortage†(IN12628, Dec. 15, 2025)
- National Association of Home Builders: Regulatory Costs Jump 40% in Five Years, Add $131,734 to New Home Prices (June 2026)
- Joint Center for Housing Studies of Harvard University: The State of the Nation’s Housing 2026
- Freddie Mac: Primary Mortgage Market Survey (30-year fixed rate, week of Nov. 12, 2026)
- U.S. Census Bureau: Historical Income Tables, Households (Table H-8, median household income, 2025)


